US PCE DATA KEY POINTS:
- August U.S. consumer spending advances 0.4% versus 0.4% expected.
- CorePCE, the Fed’s favorite inflation measure, climbs 0.1% month-on-month and 3.9% from a year earlier, in line with expectations down from a revised 4.3% YoY in July.
- Short-Term US interest-rate futures little changed after the inflation data, traders continue to bet Fed rate hikes are done.
- To Learn More About Price Action, Chart Patterns and Moving Averages, Check out the DailyFX Education Section.
READ MORE: Bitcoin, Ethereum Rally Following Latest ETH Futures ETF Application, Where Next?
Recommended by Zain Vawda
Trading Forex News: The Strategy
The latest data out from the U.S. Bureau of Economic Analysis on personal consumption expenditures was released this morning. Disposable personal income(DPI), personal income less personal current taxes, increased $46.6 billion (0.2 percent) andpersonal consumption expenditures(PCE) increased $83.6 billion (0.4 percent). ThePCE price indexincreased 0.4 percent. Excluding food and energy, the PCE price index increased 0.1 percent. The annual rate which is the Fed’s preferred inflation gauge easing to 3.9% YoY which will be a welcome relief following the recent headline inflation (CPI) data out of the US.
Customize and filter live economic data via our DailyFX economic calendar
The report stated that the increase in current-dollar personal income in August came about largely due to increases in compensation, personal income receipts on assets, rental income of persons and proprietors’ income that were partly offset by a decrease in personal current transfer receipts.
Source: US Economic Bureau of Economic Analysis
There is no doubt that the Fed will still have to keep a close eye on the demand side as well as the labor market in light of today’s report. The rise in Oil prices of late means we could see personal expenditure remain elevated for a little while longer but there are significant headwinds to battle in Q4 if this is to be the case. This in theory may hinder continued growth and consumer spending power.
Recommended by Zain Vawda
Traits of Successful Traders
US OUTLOOK MOVING FORWARD
Looking ahead and the US economy continues to run hot from a demand perspective as evidenced by retail sales and employment data. This week has also seen hawkish statements from many Fed policymakers which is a reflection of the current demand and environment in the US economy which could warrant another rate hike or potentially “higher for longer”.
However, I do see potential for a slowdown in the US in Q4 as we have the end of the furlough on student debt repayments which begins on October 1. There are also signs of a deterioration in household savings which has been one of the main reasons the US has maintained an impressive pace of growth during the post pandemic recovery. Lastly, the higher rate for longer narrative and environment as well as an increase in Oil prices could leave consumers with less spending power and thus have an impact on both growth and demand in Q4. It is definitely shaping up to be an interesting quarter. In the words of Fed policymaker Goolsbee ‘historical relationships may not hold up in the current economy’. We are definitely in uncharted territory.
MARKET REACTION
The initial market reaction to the news was rather muted from both the Dollar Index and the S&P 500 as the data has done little to change the economic outlook.
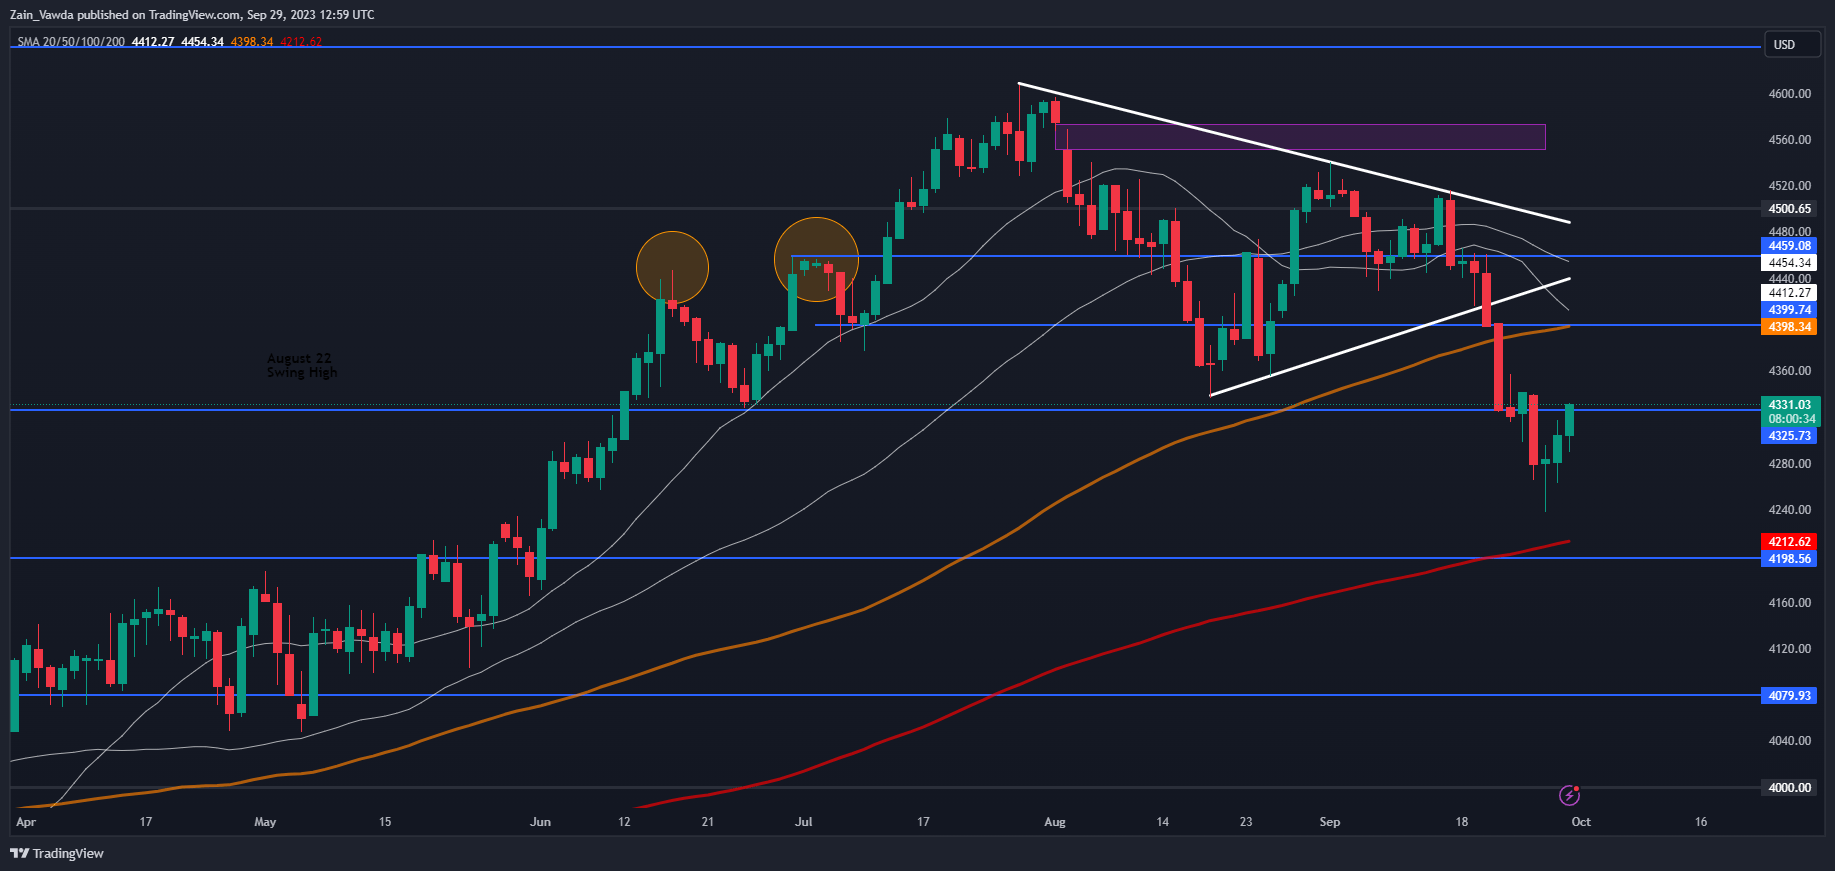
The S7P 500 has enjoyed an excellent end to the week and eyeing further gains as the quarter draws to a close. The move higher could also be done to sellers taking profit and market participants look to rebalance portfolios ahead of an interesting Q4. Should the upside rally gain further traction immediate resistance rests at 4343 before the 100-day MA comes into focus around the 4400 mark.
S&P 500 Daily Chart, September 29, 2023
Source: TradingView, prepared by Zain Vawda
| Change in | Longs | Shorts | OI |
| Daily | -3% | -1% | -3% |
| Weekly | 9% | -9% | 0% |
— Written by Zain Vawda for DailyFX.com
Contact and follow Zain on Twitter: @zvawda


