OIL PRICE FORECAST:
Most Read: What is OPEC and What is Their Role in Global Markets?
Oil rose as much as 3% today trading above the $73 a barrel handle following escalating tensions in the Red Sea. The attacks carried out by Houthis in Yemen as they push to end the offensive on Gaza which is now stretching toward a 3rd month. This is the first sign of an actual spillover in tensions that could affect Global Supply chains moving into 2024.
Recommended by Zain Vawda
How to Trade Oil
RED SEA SUPPLY INTERRUPTION AND THREATS POSED
The tensions around the Red Sea do not bode well for those who have wished that the war remain confined. This being the first sign that it may spread and affect the Global Economy, something which had been stressed by Central Bank bosses from the EU, Bank of England and the US Federal Reserve. All Central Bank heads cited their concern that the longer the war draws on the greater the likelihood of a spread which could have consequences from Global growth and the Global Economy. Just as it seems Central Banks are getting inflation under control, will the supply chain disruptions and a potential spread in the Middle East weigh on Global Markets heading into 2024? Well, if anything, these developments are likely to strengthen the belief that things may get worse in the early part of 2024.
BP stated today that It has temporarily suspended all transits through the Red Sea. This was a response to a Norwegian Vessel was attacked earlier in the day with consumers now facing the prospect of shouldering increased transport costs and time constraints for refineries. The longer the war drags on the more chance I believe there is of disruptions around the Straight of Hormus as Iranian allies in the region continue to grow bolder. This could become a key feature and focus for the early part of 2024.
LOOKING AHEAD TO THE REST OF THE WEEK
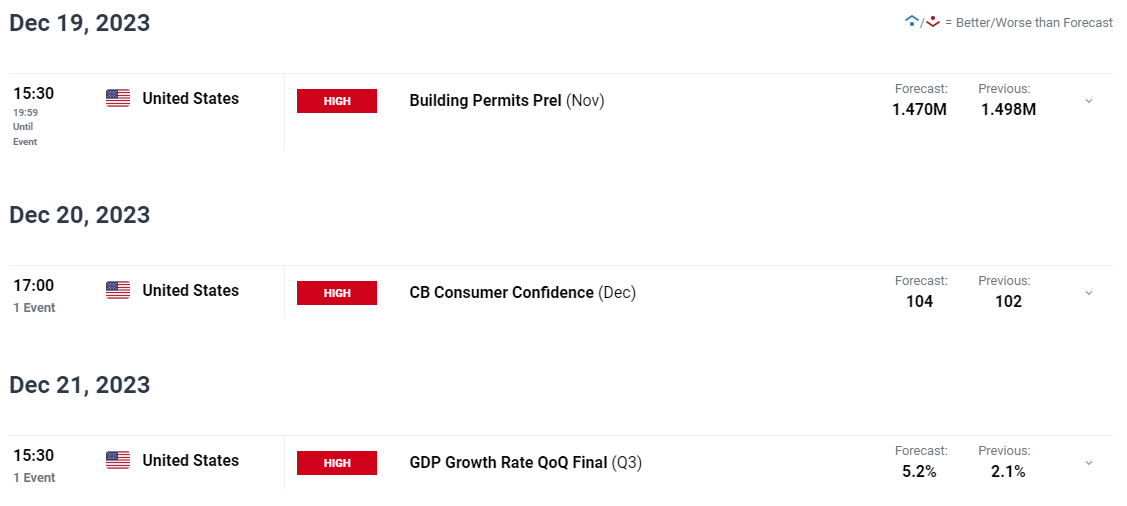
Looking to the rest of the week and the Geopolitical risk is likely to be the key driver and the most important risk to pay attetion to. There is a bunch of data and from the US and inventories data as well which could also impact on Oil prices.
For all market-moving economic releases and events, see the DailyFX Calendar
TECHNICAL OUTLOOK AND FINAL THOUGHTS
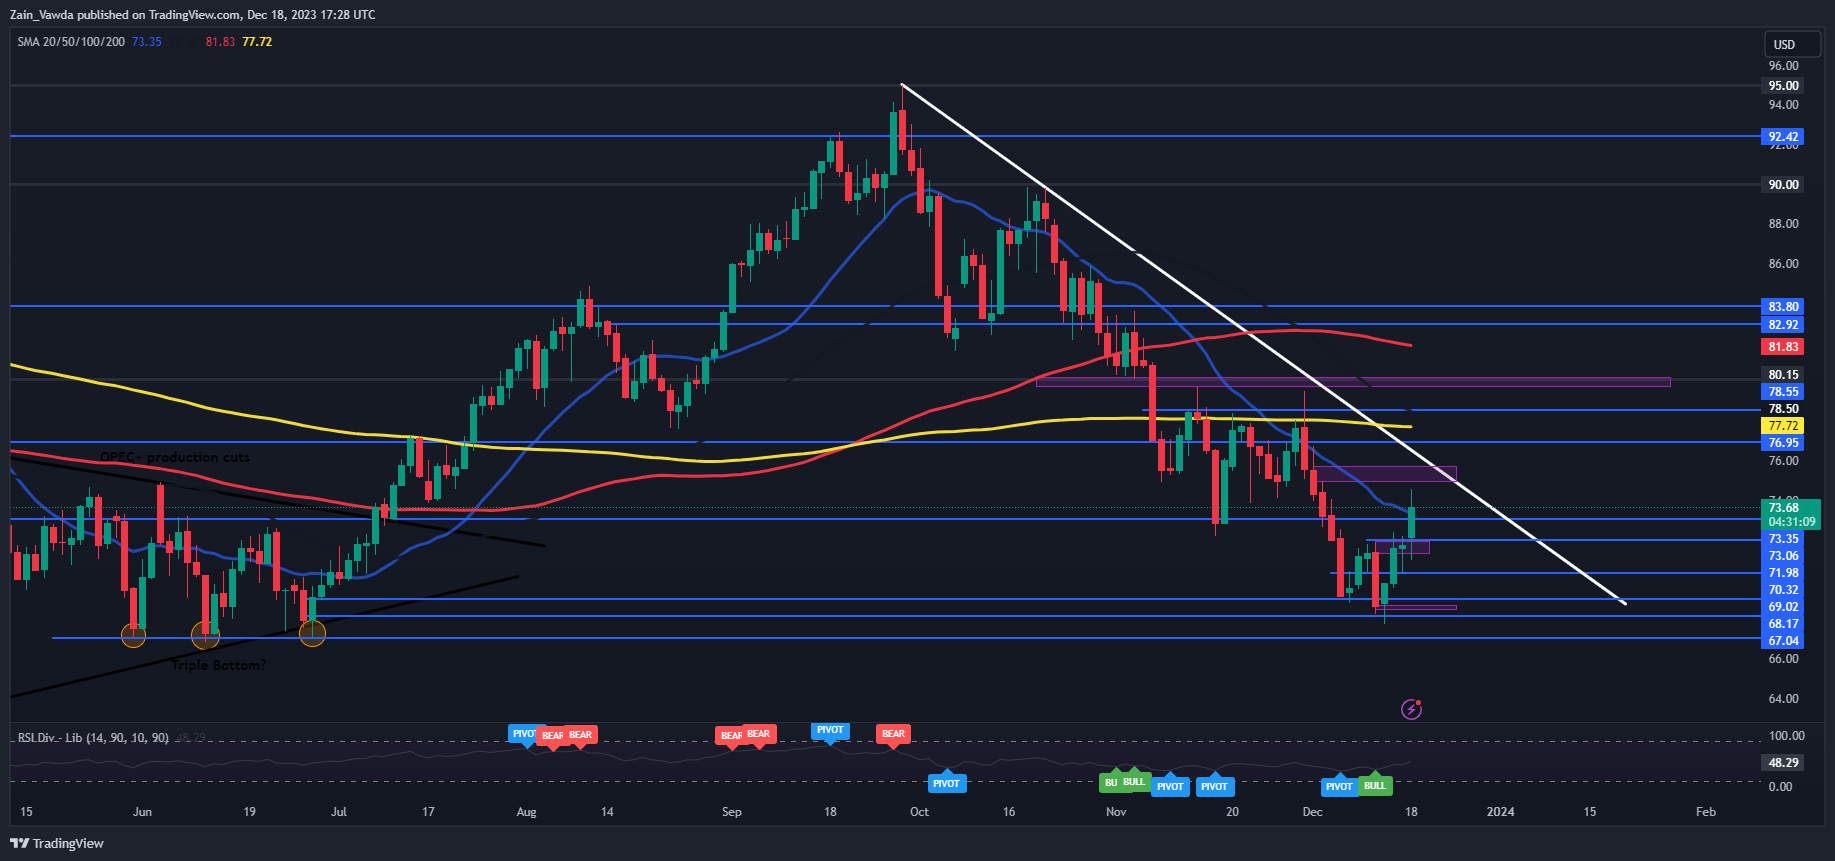
From a technical perspective WTI is attempting to close above the $73.35 mark which houses the 20-day MA with the next resistance area at the key psychological level at the $75 mark. There is also the descending trendline which could come into play at the $76.50-$77.00 area which would be the third touch of the trendline. Usually, this leads to a continuation of the trend but if the geopolitical situation remains strained we could see a break above and a push back toward the $80 mark.
WTI Crude Oil Daily Chart – December 18, 2023
Source: TradingView
Key Levels to Keep an Eye On:
Support levels:
- 73.00
- 72.10
- 70.00
Resistance levels:
- 75.00
- 77.00
- 77.72
IG CLIENT SENTIMENT
IG Client Sentiment data tells us that 83% of Traders are currently holding LONG positions. Given the contrarian view to client sentiment adopted here at DailyFX, does this mean we are destined to revisit the $70 a barrel mark?
For a more in-depth look at WTI/Oil Price sentiment and the tips and tricks to use it, download the free guide below.
| Change in | Longs | Shorts | OI |
| Daily | 0% | 30% | 4% |
| Weekly | -11% | 15% | -8% |
Written by: Zain Vawda, Market Writer for DailyFX.com
Contact and follow Zain on Twitter: @zvawda


