S&P 500 OUTLOOK:
- S&P 500 inches lower amid cautious market sentiment despite Microsoft’s strong rally following upbeat earnings
- MSFT shares jump more than 7% after quarterly results beat expectations and guidance surprises to the upside
- Attention now turns to US first-quarter GDP on Thursday
Recommended by Diego Colman
Get Your Free Equities Forecast
Most Read: USD/CAD Wavers at Fibonacci Resistance as USD/JPY Makes Move on Trendline Support
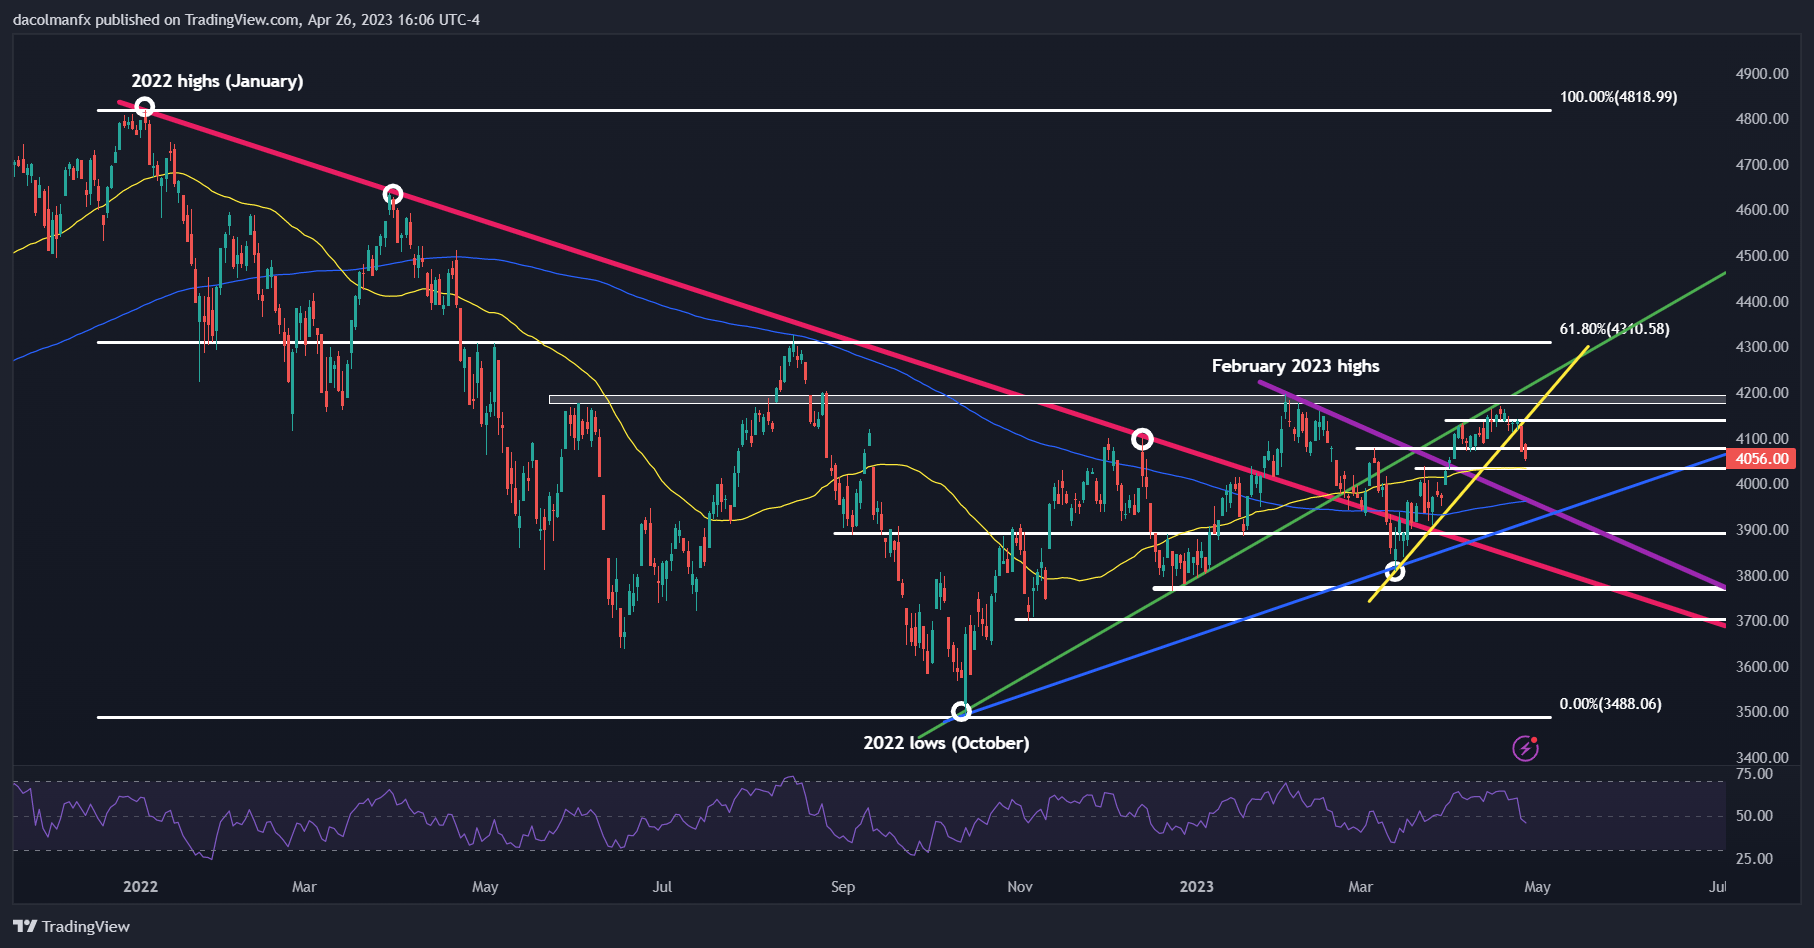
The S&P 500 retreated on Wednesday, falling 0.38% to 4,056 in a highly volatile session, with most sectors ending the day in negative territory, but tech commanding strength, supported by Microsoft’s 7.24% rally following its upbeat quarterly results and constructive profit guidance.
While the current earnings season has been encouraging relative to the overly pessimistic outlook, sentiment remains extremely fragile in the face of growing headwinds, including weaker growth and shrinking margins. Granted, business activity has held up remarkably well, but investors fear that the country is headed for a recession later this year, an event that could drag corporate profits significantly.
We’ll get more clues about the health of the economy on Thursday, when the U.S. Bureau of Economic Analysis releases its preliminary report on first-quarter gross domestic product. In terms of expectations, GDP is seen increasing 2% on an annualized basis, but downward revisions to retail sales data issued this week could set the stage for a much softer outcome.
UPCOMING ECONOMIC DATA
Source: DailyFX Economic Calendar
Looking ahead to the incoming report, traders should keep a close eye on the trend in personal consumption expenditures, the country’s main growth driver. If household spending cracks, it may not be long before the economy slips into recession. Obviously, this scenario would be bearish for U.S. stocks in the near term, but may pave the way for a rally later once the Fed begins to cut rates to boost the recovery.
Focusing on technical analysis, the S&P 500 has taken a turn to the downside after breaking below trendline support at 4,125 earlier this week, with prices heading towards the 50-day simple moving average (4,035) at the time of writing – the next key floor to keep in mind. If this level is taken out, we could see a drop towards the 200-day simple moving average in short order.
On the flip side, if buyers regain decisive control of the market and spark a bullish reversal unexpectedly, which is not the baseline case, initial resistance lies at 4,080, followed by 4,140. On further strength, the focus shifts higher to the 4,180-4,200 region.
| Change in | Longs | Shorts | OI |
| Daily | -1% | -2% | -2% |
| Weekly | 7% | -1% | 2% |
S&P 500 TECNICHAL CHART
Source: TradingView


